8/2023 (Updated) - Update of
Forecast RUT Top- On 3/30/2022 (See Below) we forecast that the
Stock Market was "Approaching a High Risk Zone". This post was
the exact top of the market with strong upward momentum.
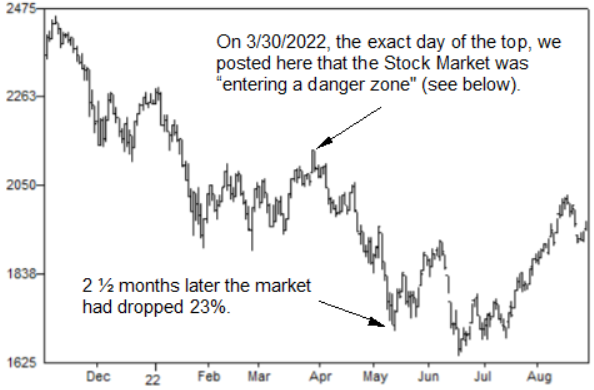
3/30/2022
- Approaching High Risk Zone. The 3/12 post showed the New
Moon (8-week cycle) in the RUT. This post updates that cycle to
the present because the next New Moon arrives very soon.
As the below chart shows, the quarter-cycle (0-90)
following the New Moon is some of the most destructive. You can
add the quarter-cycle by clicking the "Add a Cycle" icon on the
left tool bar and changing the Delta to 90.
CycleTimer settings: Geocentric; Delta = 360; Orb = 0; Synodic
Moon and Sun
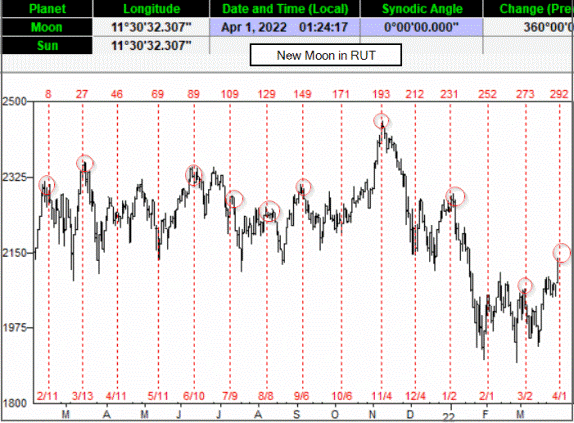
3/12/2022
-
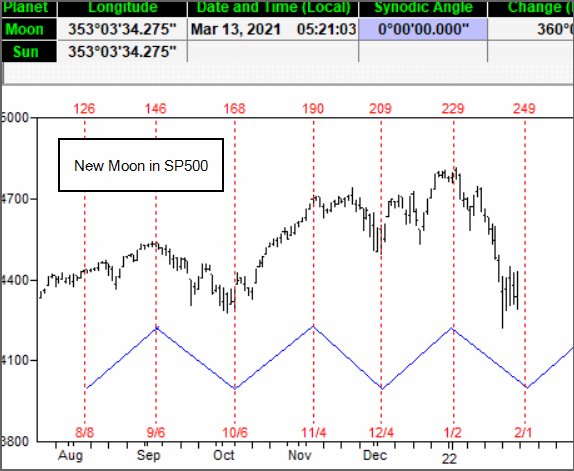
The 2/8/2022 post showed the New Moon in the SP500 covering
a 6 month period. We now expand that to one year in the Russell
2000. This index is good to demonstrate lunar cycles due to its
sideways choppy action. An index showing a strong directional
trend (such as the SP500) will overwhelm the smaller cycles.
These cycles occasionally invert top-to-top (note 3/13/2021).
This happens due to cycle alignment at the equinox (a topic for
another day).
CycleTimer settings: Geocentric; Delta = 360; Orb = 0; Synodic
Moon and Sun
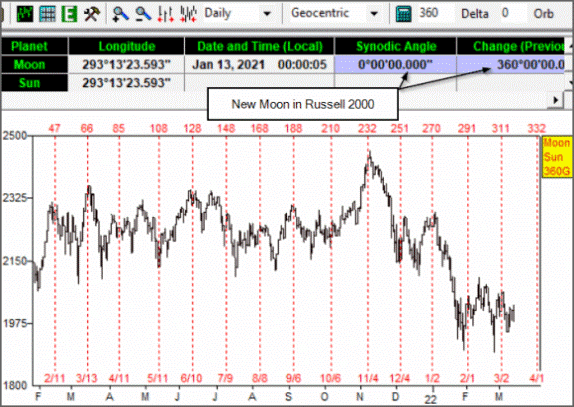
3/12/2022
-
We now add a second cycle to our chart. The only change to
make is Delta=180. This will plot all New and Full Moons. Very
few of these arrived uneventfully. And if given a tolerance of
+/- one day, every cycle aligned with a tradable turn.
CycleTimer settings: Geocentric; Delta = 180; Orb = 0; Synodic
Moon and Sun
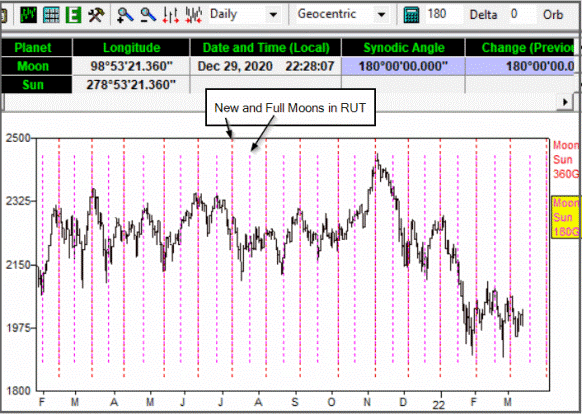
2/12/2022 -
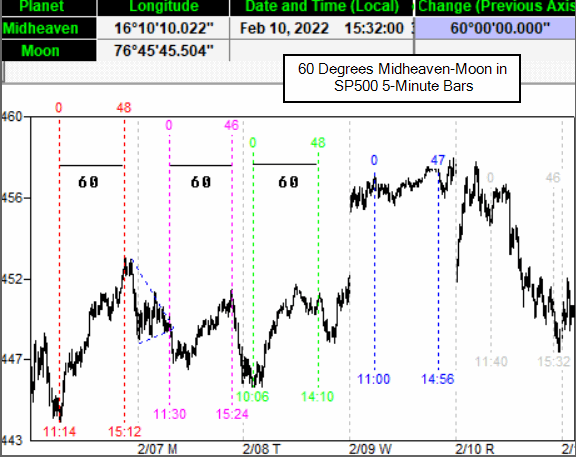
Using CycleTimer to Time SPY Intraday
The 2/8 post used the New Moon (Sun-Moon conjunction) to
time the SPX on daily charts. The Moon is also used for intraday
timing. This chart shows 5 days of the SPY last week using 5
minute bars. Because the Earth rotates one degree in about 4
minutes you can use 4 minutes bars for more precision.
CycleTimer Settings: Topocentric, New York, Delta=60, #Cycles=1,
Synodic, Moon-Midheaven
Each of the cycle starting points is a strong natural angle,
either 90 or 120 degrees apart. 60 degrees of Earth rotation
(relative to the Moon) from this starting point was another
turn. Last week they were all tradable tops.
2/8/2022 -
Using CycleTimer to Find the New Moon Trigger Points
On 2/25/2015 we posted the time cycle in the RUT that turns
on the first of the month. This cycle is further refined by
using the New Moon. CycleTimer calculates all cycles to within
1/1000 arc second, which is helpful for intraday charts and
Topocentric settings.
CycleTimer settings for below cycle: Geocentric; Delta = 360;
Orb = 0; Synodic Moon and Sun.
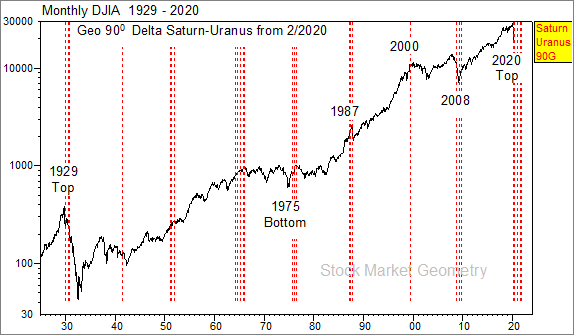
3/21/2020 - Based on page 55 of
Cowan's Pentagonal
Time Cycle Theory. Cowan showed that Saturn-Uranus cycles
repeat in the same zodiacal locations (plus one 30 degree sign) every 90
years. These first order recurrences marked the 1929 and 2020
tops. Saturn-Uranus cycles repeat on the opposite side of the zodiac
every 45 years. These second order recurrences, same angle
opposite zodiac location, marked the 1975 bottom.
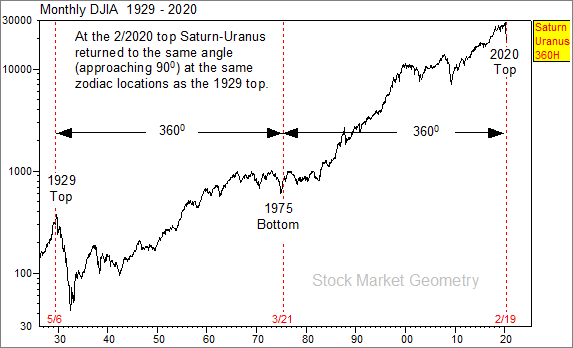
The 1930's depression was worsened by misguided government fiscal
policies. The 2020's version of destructive government intervention is
forced closures of thousand of businesses for "safe space". Many of
these businesses will never recover.
The Geocentric perspective below shows Saturn-Uranus approaching the
ominous 90 degree angles at the 1929-1930 and 2020 tops. This chart
measures Saturn-Uranus delta 90 from the 2020 top. This includes
conjunctions and oppositions. Every recurrence for the past 100 years
was significant, and lasted much longer than expected.
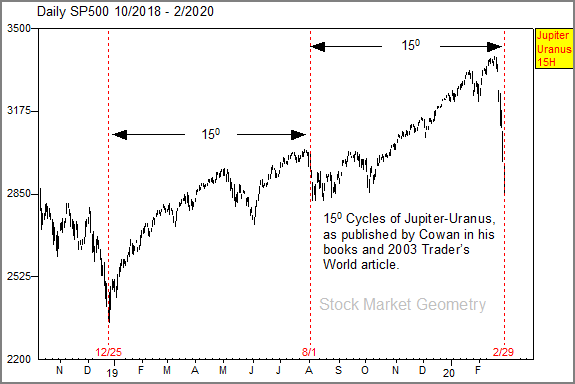
2/29/2020 - The most recent plunge
in stocks has coincided perfectly with Cowan's cycles, as
published in his books and articles. The below chart uses CycleTimer
software to calculate the 15 degree Jupiter-Uranus cycle
measured from the 12/25/2018 low. It coincided perfectly with
the August 1, 2019 and February 2020 drops.
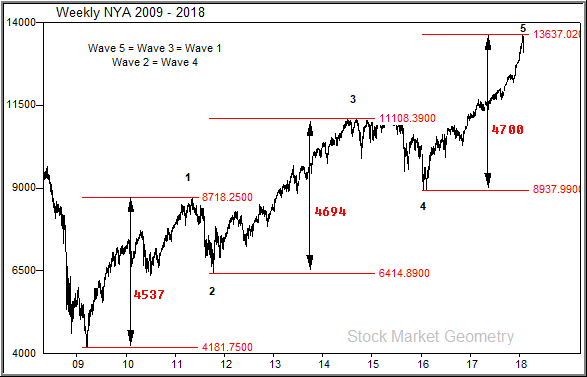
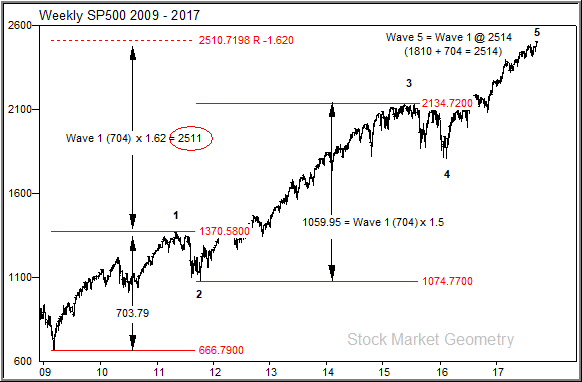
2/3/2018 - On 9/2017 (see below) Dawa Raju of India
submitted his Elliott Wave analysis of the SP500 using CycleTimer
software. In this chart he updates that analysis to present. His
original analysis showed potential resistance when Wave 5 = Wave 1. His
current chart shows that the most recent top occurred when Wave 5 = Wave
3.
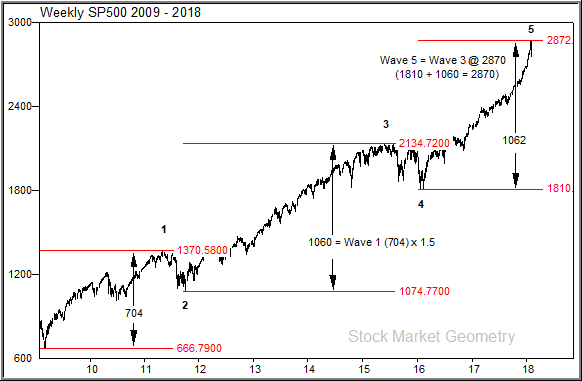
The broad based NYA shows:
Wave 5 = Wave 3 = Wave 1
Wave 2 = Wave 4 = 50% correction of preceding wave.
9/23/2017 - This chart was submitted
by Dawa Raju of India. He is a long time student of Gann and Cowan. It
is his analysis of the Elliott Wave and Fibonacci structure of the
SP500 using CycleTimer
software.
5/20/2017
-
CycleTimer analysis using Cowan techniques
shows the astro alignment in July to be very dangerous.
Read the complete article.
12/11/2016 -
Has the 17-Year Cycle Bottomed?
Shortly after the November, 2016 bottom we posted that a major
bull advance was under way. Six months later the market has rocketed
higher than anyone expected (except Stock Market Geometry).
1/18/2016 -
Bradley F. Cowan
published
Pentagonal Time Cycle Theory in 2009 where he forecast
late 2016 as a major stock market bottom.
His based this forecast on the pentagonal subdivision of the 84-year
cycle into five smaller 17-year cycles.
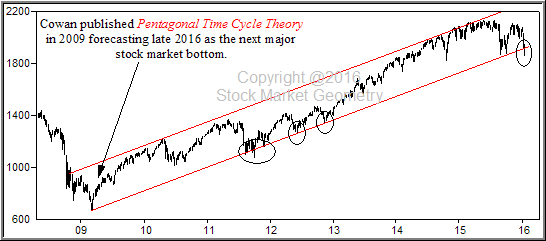
The chart below updates the lunar cycle and Price by Degree
posted last year. The most recent
top coincided perfectly with prices arriving at the intersection of
these 2 lines.
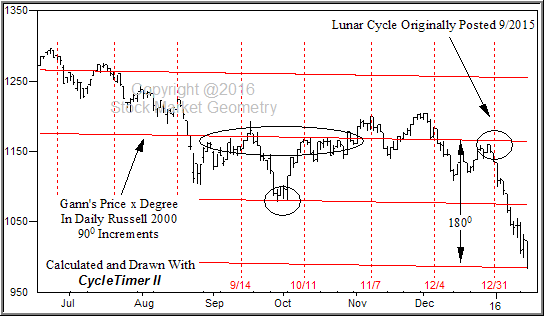
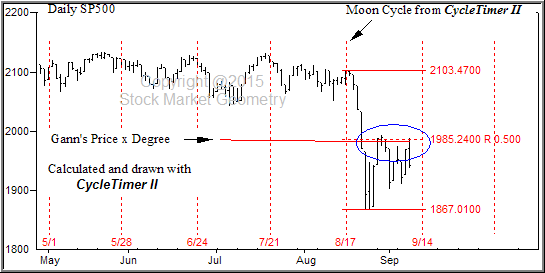
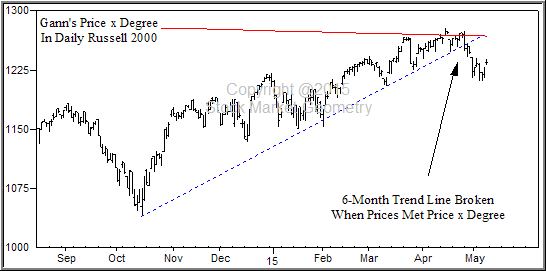
9/10/2015 - In May we began posting
(see below) several charts warning that the Russell 2000 was up against
Gann's Price x Degree. In July prices backed away from that resistance
line for the last time and collapsed.
The chart below shows the same Gann Price x Degree in the SP500. Prices
rallied back up this resistance line at the 50% retracement. Also shown
on this chart is a proprietary lunar cycle that coincides with market
tops.
6/9/2015 (Chart Updated Again 6/15) - One month ago we posted
(below) a chart of the Russell 2000 with Gann's Price by Degree. Since
then, prices advanced back up to exactly touch that line and retreated.
(Since 6/9 prices have again bounced off the Price x Degree).
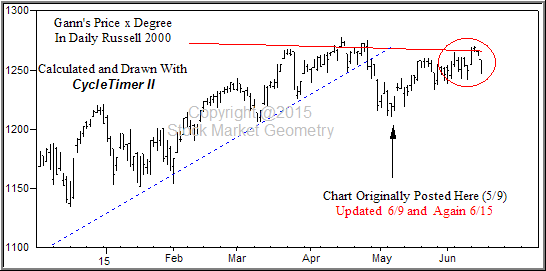
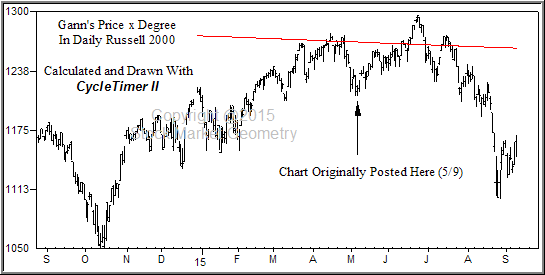
5/9/2015 - The efficacy of Gann's "Price by Degree" in
timing the SP500 has been well documented over the past year in the
below posts. This same tool also timed the 4/27/2015 top in the Russell
2000. Since October 2014 the Russell had been following a linear trend
until running into the Price x Degree. This top also coincided with the
cycle shown below in the 2/25 post.
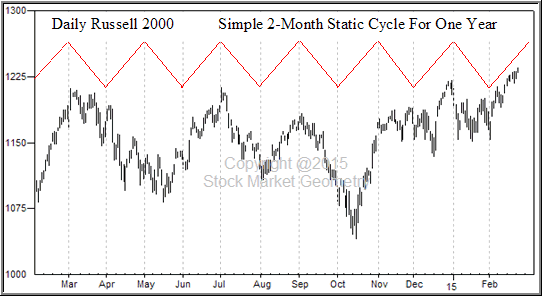
2/25/2015 - Sometimes a simple
static cycle is all you need. This chart shows a 2-month top-to-top
cycle in the RUT for the past year. The start of every other month has
seen selling.
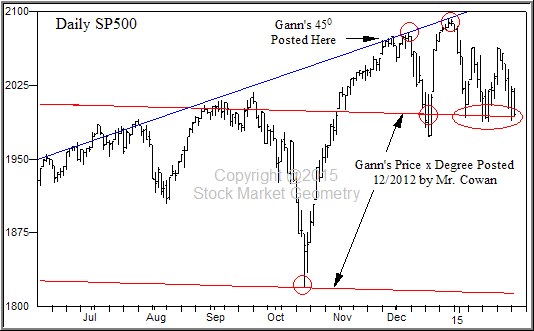
1/8/2015 (Chart updated again 1/31/15) - This chart
updates the two Gann lines previously shown in the SP500. Key areas
since the last post are circled. A picture is worth 1000 words!
12/13/2014 On 11/28 (see below) SMG staff posted that
the SP500 had reached balance at the upper Gann Angle defining the trend
since 2009. The warning was also given that the time count was at the
critical 144 multiple that defined the duration of the 1994-2000 move.
Prices have since dropped back down to the Price x Degree line first
disclosed by Mr. Cowan in 2012.
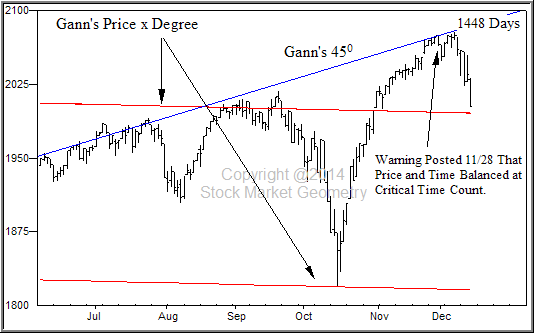
11/28/2014
- Anyone studying Cowan or Gann's works are familiar with the
importance of 144. The total number of trading days during the 1994-2000
move was 1447. From the 2009 bottom through today it is 1444.
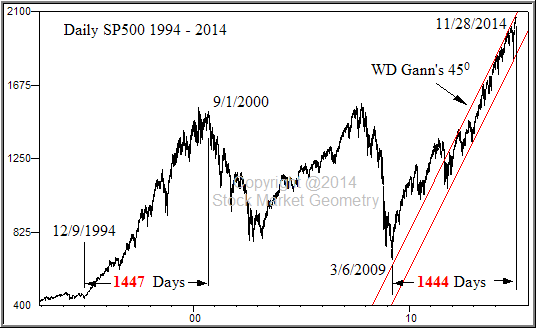
The trend has followed Gann's 45 degree angle since the
2009 bottom, or one point per trading day. This angle represents the
balancing of price and time. CycleTimer owners can play with this angle
from various tops to find its exact location now.
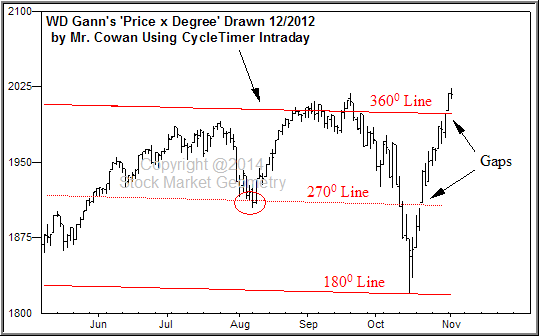
11/4/2014 - This
chart updates the SP500 with the previously shown WD Gann Price by
Degree. Added to this chart are the 270 and 180 degree lines, which exactly
defined the recent bottoms. CycleTimer owners can reproduce these lines
by formatting to subdivide by 4. Doing this creates the "Squares".
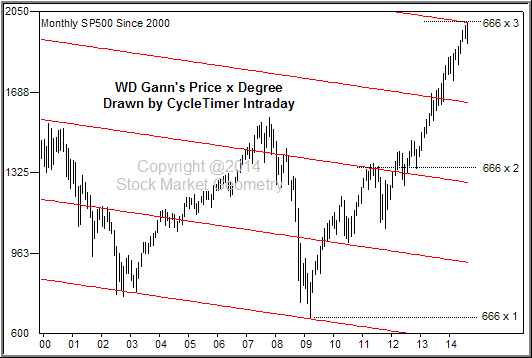
10/1/2014 - On 8/30/2014 SMG
staff posted WD Gann's Price by Degree for the SP500 on a 15-year
monthly chart (see below). When combined with the 3rd 666 square off the
2009 bottom the trend reversed.
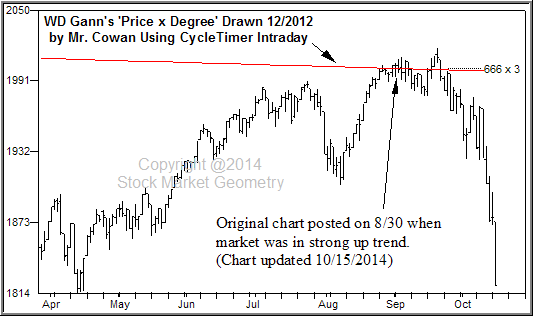
8/30/2014 - Below is
an update of the chart sent to CycleTimer owners in 12/2012 showing WD
Gann's Price by Degree. CycleTimer owners are encouraged to repeat this
calculation.
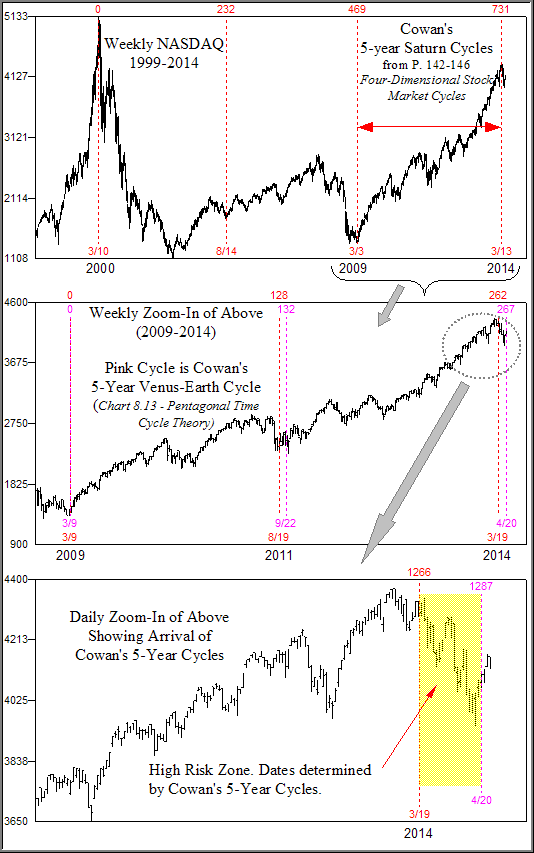
4/2014 - "The smallest complete cycle is five years."
..WD Gann Master Courses
In Four-Dimensional Stock Market
Structures and Cycles Cowan identified the Saturn 5-Year cycle
using data back to the 1700's. The below chart uses CycleTimer to
automatically calculate that cycle anchored at the 3/2000 top in the
NASDAQ.
The middle chart zooms in on the 2009-2014 5-Year Saturn cycle and adds
Cowan's 5-Year Venus-Earth cycle. The bottom chart zooms in further on
the top using daily data.
1/24/2014 - If you want to
understand the January 2014 Stock Market drop look at Cowan's 2013+
Forecast (Page 4) which listed 1/18/2014 as a major cycle. He showed
this natural cycle recurred at the tops in 8/1987, 1/1994, 2000, and
2008.
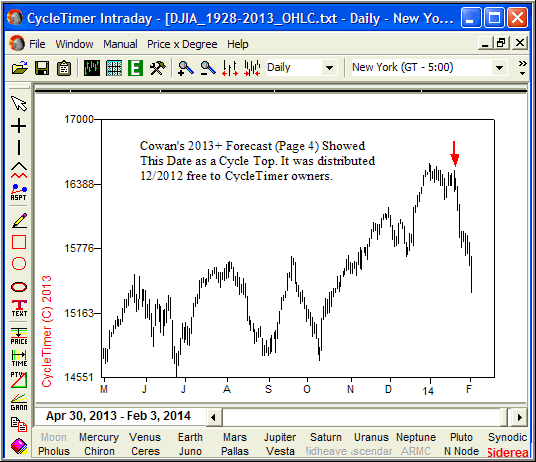
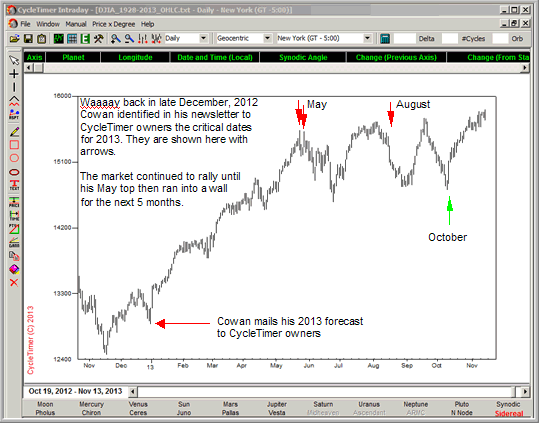
11/2013- In late December 2012
Mr. Cowan's 2013+ forecast was sent to
CycleTimer owners. It listed 3 dates as critical in 2013, May
21 & 28, Mid-August, and October. The below chart of the DJIA
shows the results.
7/2013 - Four and a half years
ago, Cowan published
Pentagonal Time Cycle Theory where he presented his
independently discovered market cycle equation, based on the Square of
Twelve. He used that equation, anchored 50 years in the past, to
project the two cycle top dates shown below. In December, 2012 owners of
CycleTimer software received his Market Forecast, which again forecast
these exact dates as the top. That same newsletter included WD Gann's
PricexDegree of the Moon's North Node used as price target. When these
cycles and resistance lines met, circled below, the top was reached in
both price and time.
If you thought you were saving a few dollars by not buying CycleTimer
and not receiving his forecast you were "Penny Wise But Pound Foolish".
The few dollars spent would have been easily made in just a few hours
shorting this market on Cowan's dates.
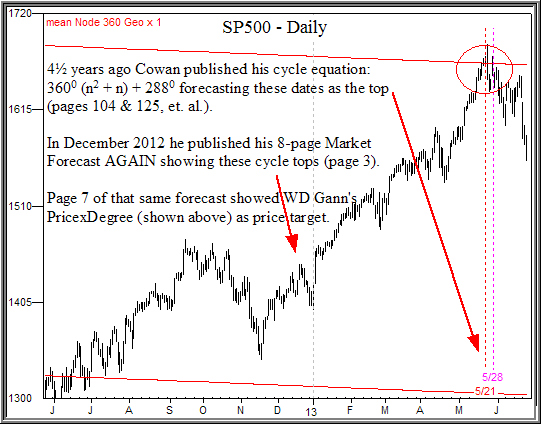
Update of Chart Cowan Presented to CycleTimer Owners in
December 2012
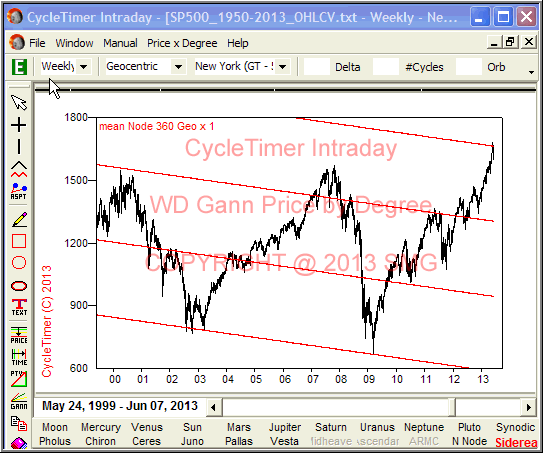
6/9/2013
- WD Gann's Price by Degree
CycleTimer owners who received Mr. Cowan's Market
Forecast were presented in December with a chart of the SP500 and WD
Gann's Price
by Degree using the Moon's North Node. CycleTimer Intraday is used to
update that chart below.
6/2/2012
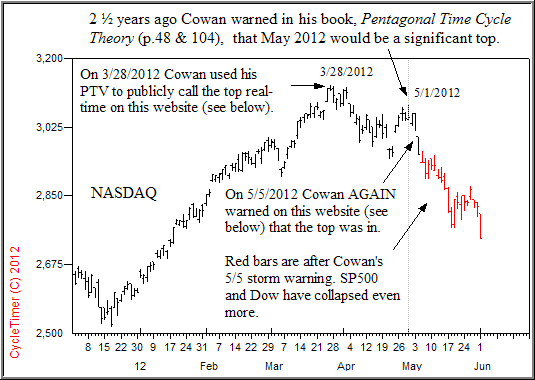
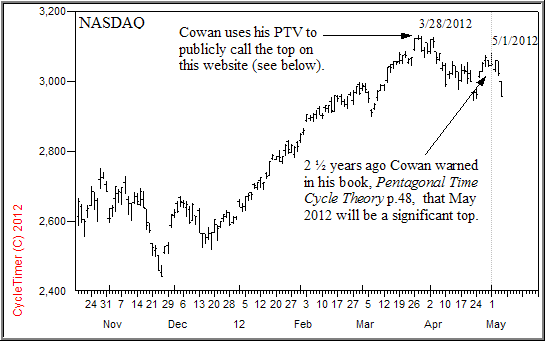
5/5/2012 - You Were Warned!
2
1/2 years ago, Cowan used his unique and independently discovered
methods of cycle analysis to publish in
Pentagonal Time Cycle Theory (p. 48 & 104) that May 2012 would be a
major stock market cycle top. When the first top arrived real-time Cowan
posted here (see 3/28 post below) warning again that a top was complete.
He used this as a teaching opportunity to show how easily anyone can use
his PTV to time market turns with the assistance of
CycleTimer software. The technique was so simple and the
results so undeniable that anyone unable to effectively use these
techniques should not be trading, nor do their opinions merit attention.
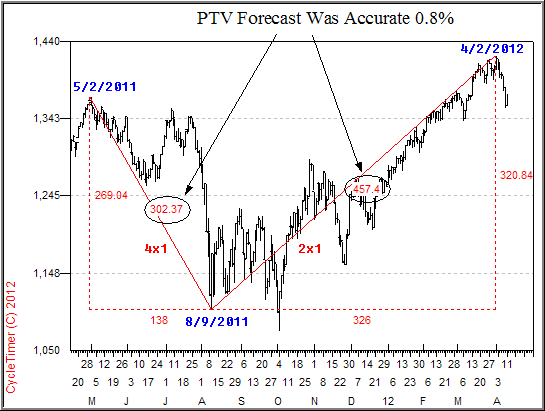
4/12/2012 - Cowan Nailed SP Top Using His PTVs With
Accuracy of 0.8%
Two weeks ago, at the top, Cowan identified the top using his PTVs (see
below). Since then, the largest two week decline of the year has
occurred. The
accuracy of his PTV projection was better than 1%, which is well within
the resolution of the SP500 data. His simple PTV forecast was: 302.37 x
1.5 = 454.55. The top hit at PTV=457.4, which is 0.008 from the
forecast. Proving once again with REAL TIME forecasts the unmatched
power of his techniques. Of course, his other techniques as well as
those of Gann can be combined with his PTV to improve this accuracy even
more.
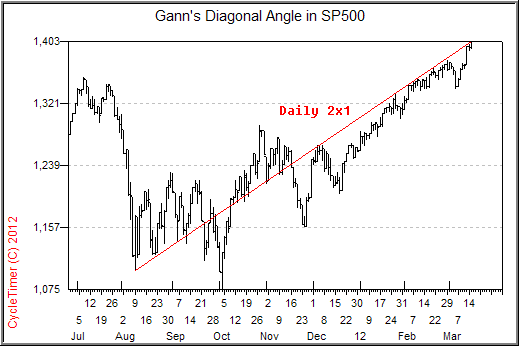
3/28/2012 - Cowan PTVs Nailed Today's SP500 Sell-Off
Many years ago Cowan discovered the PTV (Price-Time Vector). When he published his work in
Four-Dimensional Stock Market Structures And Cycles
no one was doing anything even similar to it. Years later it continues
to work and nail market tops and bottoms with unmatched precision.
Below is the SP500 showing Gann's diagonal angles and Cowan's
corresponding PTVs. The March 16th post (below) identified the 2x1 angle
as the SP500 trend. Because of that trend the PTV tool in
CycleTimer is format with the time component x2. The PTVs
along Gann's angles are shown below and proves once again how
beautifully Cowan's techniques work. The 3/27 top in the SP is EXACTLY
1.5 times (musical fifth) the PTV from the previous top, i.e., 450/300 =
1.5..beautiful! Only readers of Cowan's work are aware of this
four-dimensional technique.
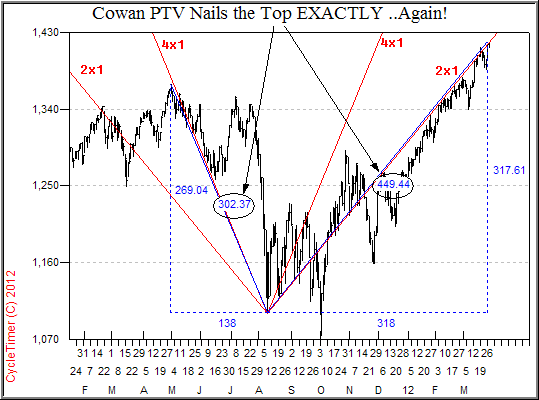
3/16/2012 - SP500 Following Gann's 2x1 on Daily Chart
The SP500 has been following the simple 2x1 Gann diagonal angle since
the August bottom.
CycleTimer users can simple format their Gann tool
for 2x1 and draw the angle to upper right. Then click on the August
bottom. You can then move the angle by clicking the Selection arrow,
click your starting point, then drag/drop. Simple and effective
technique for trend followers.
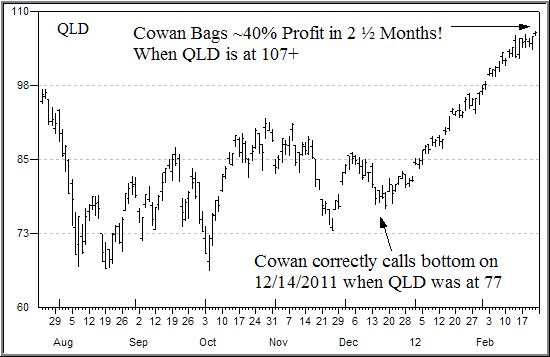
2/27/2012 - On 12/14/2011 when the QLD (Nasdaq ETF) was at 77 Cowan called the
bottom (see below). Today he closed his position for a ~40% profit in 2
months. Students of Cowan know his philosophy of "only a fool holds out
for top dollar".
2/3/2012
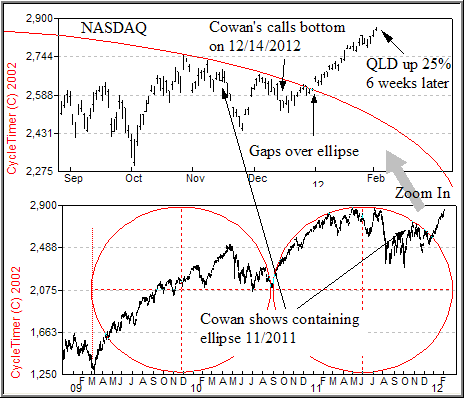
-
In November, 2011 Cowan showed the ellipse
containing the NASDAQ (below). Prices continued within that ellipse for
two more months until Cowan called the 12/14/2011 bottom. Two weeks
later prices gapped over the ellipse. The QLD (NASDAQ ETF) is already up
25% since Cowan called the Great Pentagram Cycle bottom.
1/3/2012
-
Once again...Cowan was dead-on accurate
with his cycle forecast posted here on 12/14/2011 (and 12/12). Today the
NASDAQ is already up 60 points as it broke out of its compression zone.
The day following Cowan's 12/12/2011 post
about BIDU it dropped from 130 to 110 (15%) in two days! He warned to
tighten stops to lock in profits because the Great Pentagram cycle was
due to bottom...It did...right on schedule as Cowan posted.
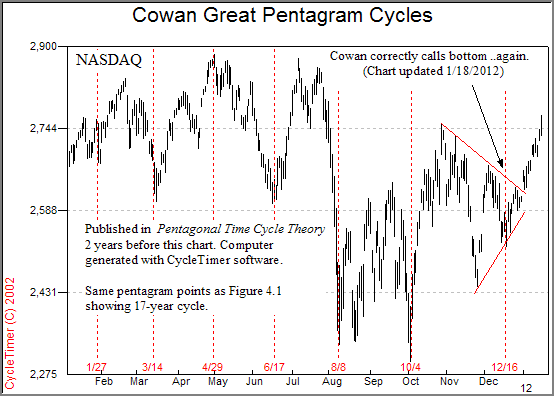
This cycle was discovered by Cowan and is taken right out of
Pentagonal Time Cycle Theory (Figure 4.1). It is reproduced below
using
CycleTimer software. So easy a retarded monkey could do it.
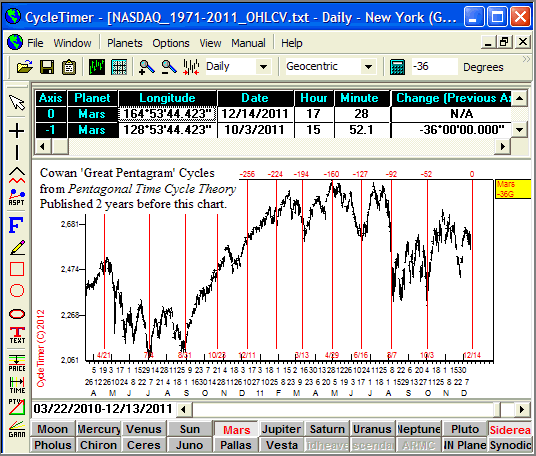
12/14/2011
-
Two days ago Cowan identified a triangle
that had formed in BIDU and that it was ready for a breakout. Two days
later this stock is already down 10% (130 to 116), demonstrating
real-time trading rules (buy or short when the line is crossed)
resulting in huge short-term profits.
The below chart shows how Cowan's "Great
Pentagram" cycles have worked out in the NASDAQ since he published this
cycle in
Pentagonal Time Cycle Theory.
CycleTimer software is used with "now" (12/14/2011) as the
starting date. This cycle has been dead-on accurate for over 2 years
since Cowan's publication. Market turns can be expected when this cycle
arrives at the Great Pentagram in BOTH geocentric and heliocentric .
That is why the astute trader will follow his BIDU profits down with
close stops. Simple trading techniques showing real-time how easy it is
to apply Cowan's techniques.
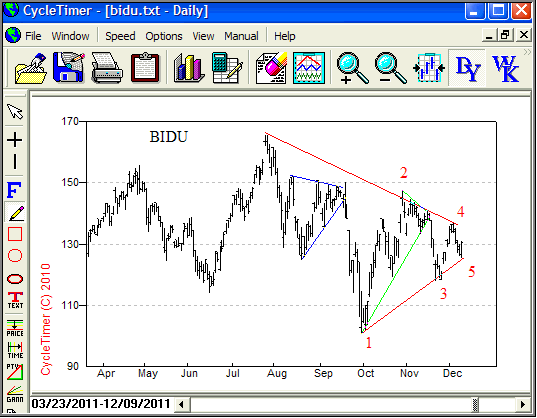
12/12/2011
- BIDU Has
Been Compressing Since July. Watch For Breakout.
The chart below shows 3 fractal examples of
BIDU compressing into triangles. Two completed with dramatic breakouts.
The larger third triangle (red lines) is still forming with a high
energy breakout likely after penetration of either of these lines.
Elliott Wave analysts look for 5 waves inside diagonal triangles with a
breakout to the upside. The magnitude of the breakout is typically equal
to the widest part of the triangle, in this case 65 points, or about 50%
above current levels. Either way, up or down, a breakout of the red
lines will indicate direction.
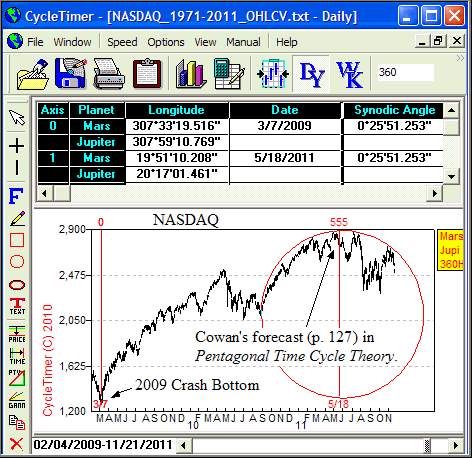
LEARN HOW COWAN FORECAST THE MAY 2011 TOP
TWO YEARS IN ADVANCE!
Nearly
two years before the recent stock market top Cowan published its
expected date in Pentagonal Time Cycle Theory (page 127). The
below chart uses
CycleTimer software to reproduce that cycle. This cycle
has special pentagonal significance only explained in Cowan's latest
book. This cycle is due to return again in 2013 with even more profound
consequences.
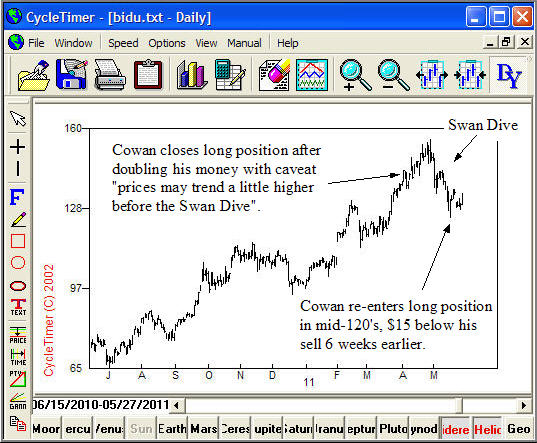
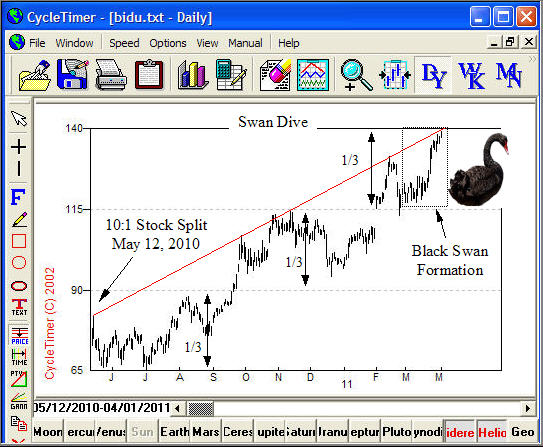
6/2/2011
-
Anyone following my 4/2/2011
advise (see below) to sell BIDU at 140 and buy back later has already made a
lot of money. As forecast, the stock trended higher into a "BULL TRAP" for a
few days until taking the Swan Dive down to 124 only 6 weeks after I sold at
139.25. I always sell into strength using market orders. As the chart below
shows, prices drop quickly from the top. My re-entry point is ~$15 below my
4/2/2011 sell price, or about 10% in 6 weeks.
4/2/2011
-
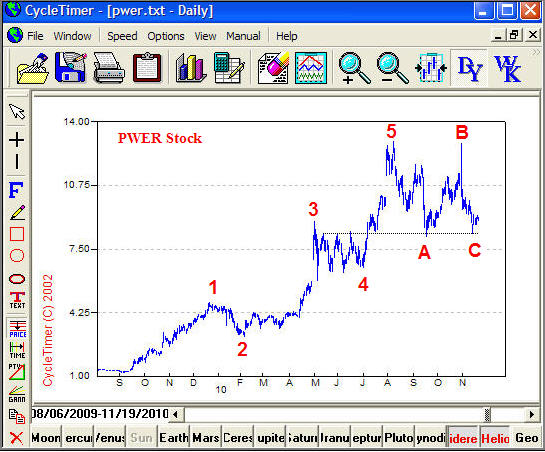
My PWER trade on November 22, 2010 was again dead on accurate. That
bottom at 8 3/4 was followed by a fast advance beyond 12 for a profit of
~40% in a little over 2 months. Because I have received several emails
asking when to sell, I am outlining simple techniques not commonly used
that any trader can learn.
Several years ago I wrote about the
Black Swan Formation and successfully demonstrated its application
in real-time trading. The Black Swan is found in all markets and is shown below in BIDU. It
consists of 3 parts; a base-building smooth bottom, a quick
mark-up in prices (neck of the swan), distribution (head of the
swan). Geometrically, this is an unfolded ellipse. The extent and
duration of the Black Swan repeats. The BIDU chart shows the same price
and time movement June-July, 2010. Each of these swans divided the
entire move shown on this chart into 1/3. The Black Swan typically
dives after it forms.
Additionally, the upper trend line since
the May 2010 stock split has defined the trend. Prices are now near this
trend line. Using these simple techniques the trader would sell knowing
that the risk/reward ratio was too high, with stops placed above the
trend line. Although prices may follow that upper trend line a little
longer, the words of the famous American whiskey bootlegger of the
1920's, Joseph Kennedy, are apropos, "only a fool holds out for top
dollar".
For these reasons and others I liquidated
my entire BIDU position yesterday at 139.25. Some was purchased at 69.5
and the rest at 99.25, nearly doubling the earlier purchase in 9 months.
I may repurchase in the future.
11/22/2010 - Effective use of technical analysis
does not have to be complicated. When a stock is in an early growth phase
linear trends and support/resistance levels are much easier to identify.
Simple methods of analysis such as Elliott 5-3 patterns can still be used
even if you have more sophisticated methods. PWER stock is a good example of
this. The daily chart for the past year shows a 5 wave up, 3 wave down
pattern with support at the linear "A" and "C" levels. My buy-in on PWER has
been in the 8.75-9 level over the past few days.
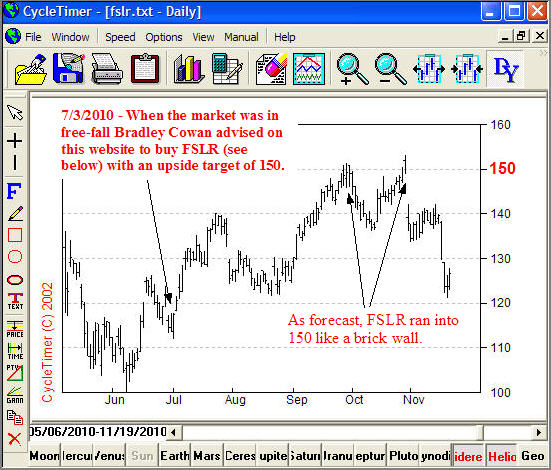
10/31/2010
-
FSLR hits Cowan's 7/3/2010 price target of 150 and plunges, proving
Cowan's forecasting techniques work in both PRICE and TIME.
On 7/3/2010 when FSLR stock was trading at
120 Cowan forecast here (see below) that it would run up to 150. That
price target has been hit twice followed both times by 10%+ drops.
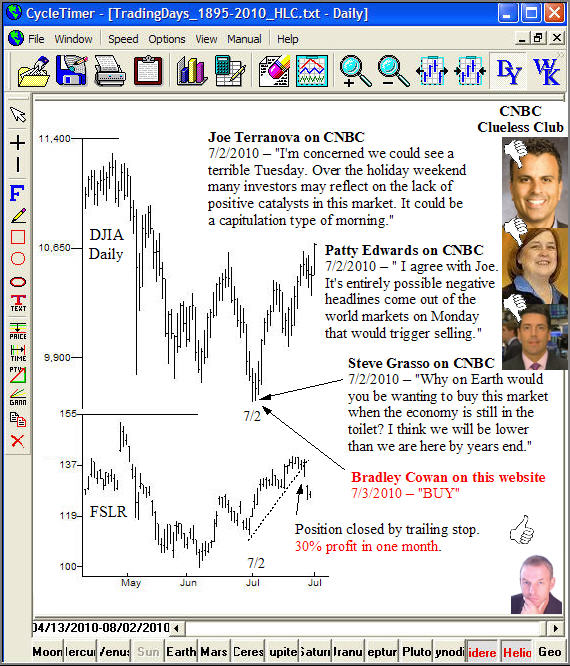
8/3/2010 -
One month ago at the 7/2/2010 bottom every
talking head on the airwaves was in full panic mode calling for a
"double dip" recession and much lower prices. (See chart below). The
CNBC Clueless Club cited the "death cross", as they called it, of the
50-day moving average crossing the 200-day. The rampant pessimism can be
seen by watching this CNBC video recorded on 7/2/2010,
www.cnbc.com//id/38058478.
While the CNBC Clueless Club was calling
for more selling, Cowan made his first BUY recommendation in 3 months,
giving FSLR stock as a good example. His accumulation price was 100-105,
and when made public on 7/3 FSLR was trading at 120. FSLR immediately
shot up to 140 three weeks later, for a quick profit of 16% from 120,
and 40% profit from 100 a month earlier! As is always the case, the
position was followed by trailing stops. This lets the market decide
when to close the position.
7/3/2010
-
FSLR stock - A textbook example of stock manipulation.
FSLR (shown below) is a good example of
smart money manipulating the public into "playing their game" by issuing
buy recommendations as they distribute their stock. FSLR had been in a
downtrend since 2007 until it was broken at $112 on high volume on March
26, 2010. The volume indicates that the smart money was buying, yet no
"buy recommendations" were issued at that time. A month later FSLR was
at 152 and 5 different brokerage firms issued "strong buy"
recommendations to the press. Volume spiked as they distributed to the
public the stock they bought a month earlier. Prices immediately tumbled
all the way back to the trend line at 100.
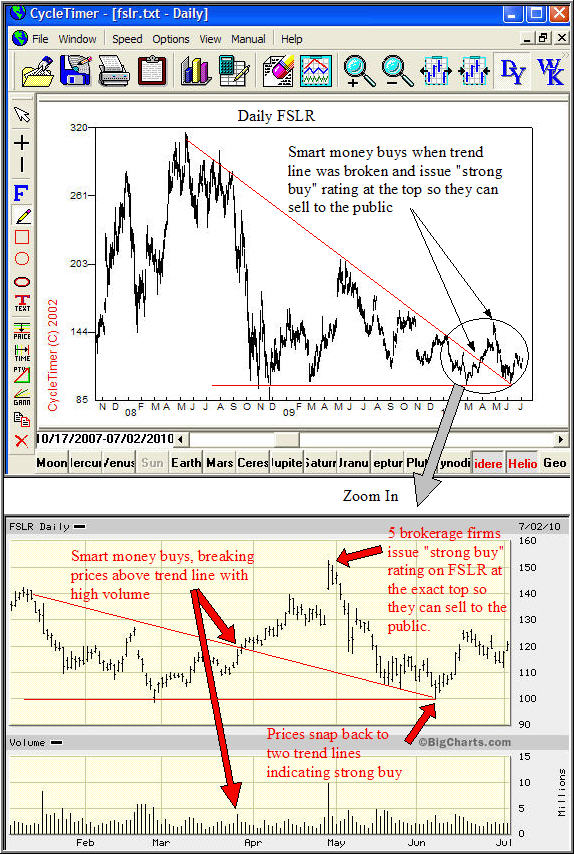
When you listen to "buy" or "sell"
recommendations you are playing another man's game, and you are certain
to lose. The charts never lie. All the manipulation is recorded in the
price and volume action for the sharp eye to discover.
I have been accumulating FSLR for the past
2 months whenever it drops down to the declining trend line, typically
in the 100-105 price range. Upside target is when it returns to the
October 2009 gap around 150.
3/5/2010
2/5/2010 -
COWAN LOWERS TRAILING STOP TO LOCK IN PROFITS. REVIEW BELOW POSTS
FOR COWAN'S REAL-TIME FORECASTS OF THIS DECLINE
Readers of
Pentagonal Time Cycle Theory understand that the current
decline in the stock market arrived right on time. Review the 9
degree harmonics of Table 6.1. Or, more simply, just enter 45
degrees in
CycleTimer, as shown below, with the start date at "now".
The same result is obtained by setting the cycle start date to the
reopening of the stock exchange in 12/1914, advancing at the rate
of 45 degrees. You will see the cycle originating at the crash low
of 1987 (or 1914) hit again at the 9/1998 low, and now.
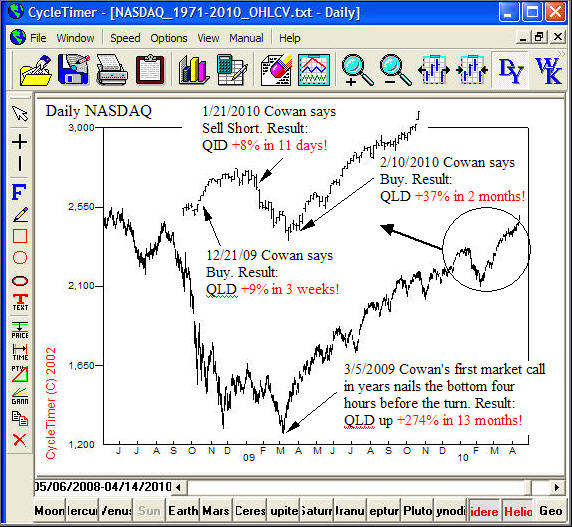
1/30/2010
-
DOUBLE BULL'S EYE! - NASDAQ UPDATE
On December 21 Cowan posted (below)
the two trendlines defining the NASDAQ. He told traders to buy
when the upper 45 degree Gann line was broken followed with
trailing stops. And to short when prices fell below the lower
trendline.
The below chart updates the action since then.
DOUBLE BULL'S EYE!
Immediately after the posting, prices
completed the 4th Elliott Wave and ran up 100 points in 2 weeks.
The top was reached when the two trendlines converged in time, as
is typical of compressing 4th wave triangles. Following Cowan's
second recommendation to short when the lower trendline was broken
at 2280, traders have since accumulated another 140 points in a
little more than one week!
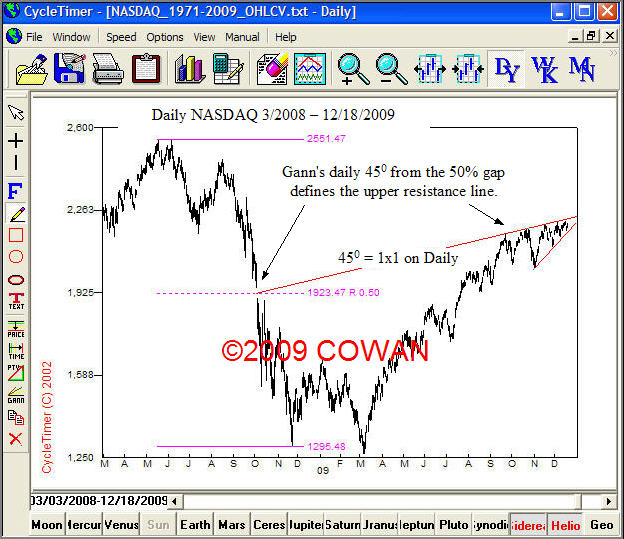
12/21/2009
-
NASDAQ UPDATE
Since September 2009 The NASDAQ has been compressing between two trend
lines. The upper line is the Gann 45 degree angle on the daily chart
measured from the 50% retracement gap in October 2008. Gaps typically
occur at the exact midpoint of a move. These are the points of maximum
velocity and zero acceleration. It's the same principle of simple
harmonic motion taught in physics. If a theoretical ball is dropped
through a hole drilled thru the Earth it reaches maximum velocity at the
center of the Earth. In a falling market this manifests as a gap. When
prices break out above the 45 degree angle it has overbalanced and
represents an entry point for traders followed with trailing stops. A
break of the lower trend line would similarly represent a good short
entry point
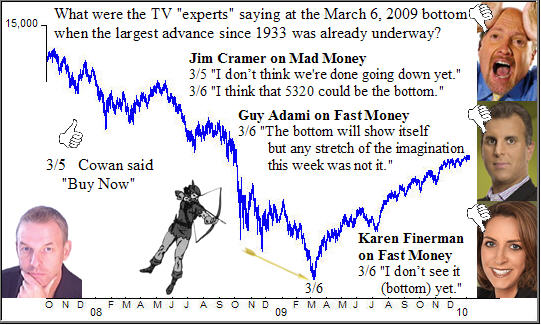
LEARN HOW COWAN CAUGHT THE FALLING KNIFE AT THE
3/6/09 BOTTOM!
The general consensus is that you don't try to "catch a
falling knife". That is, don't try to call a bottom, just trade the
trend. For most traders that is good advice. But Cowan has a proven
track record of doing just that,
calling tops and bottoms as they occur real time with uncanny
accuracy. He did it again on March 5, 2009. Using
CycleTimer software and the
techniques taught in his courses Cowan made his first public market call
in many years. He called a bottom and advised traders to buy
immediately. The post was made here FOUR TRADING HOURS before the actual
bottom and can be seen below in its original form.
Educate yourself so that you can make your
own informed decisions. If you are basing your trading or investing
decisions on anyone other than yourself you are making a huge mistake.
Just look what the so called "experts" were telling their audiences at
the bottom in March.
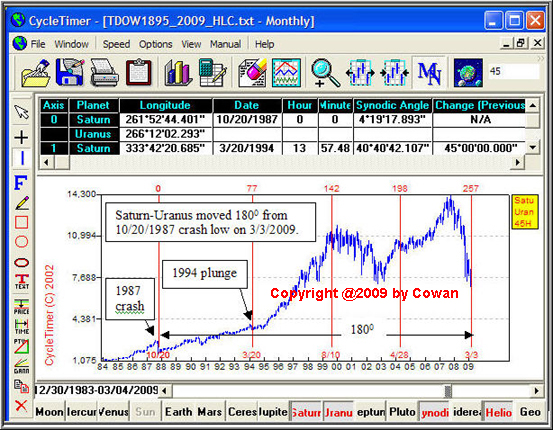
3/16/2009 -
COWAN RAISES STOP TO 7250 LOCKING IN 650 PTS PROFIT!
"This is a powerful long-term cycle that I explain in
Chart VIII.I in my book. It has moved exactly 180 degrees from the 1987
crash low. Anybody that has my books and didn't profit from this rally
should kick themselves. I would love to see it pull back and take out my
stop so I can buy lower. But I wouldn't be surprised if this doesn't happen
until 8000 is hit"
3/16/2009
-
Position closed BY trailing stop at 7250. Trade result IS 650PTS
PROFIT IN 7 TRADING DAYS. WILL BUY BACK LATER TO CONTINUE THIS
POWERFUL UP CYCLE.
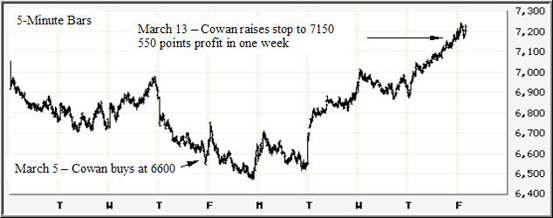
3/13/2009
-
TODAY COWAN RAISES STOP TO 7150 LOCKING IN 550 PTS PROFIT!
On 3/5/2009 when the market was below 6600 and still falling the
CNBC talking heads were cowering in fear in their makeup rooms. No
one was calling a bottom. FOUR HOURS before the actual
bottom on 3/6 Cowan made his first public forecast in many years
right here on this public web page, open for all to see, telling
investors to buy now. The original unedited posting is below.
One week later Cowan has raised his stop to 7150 locking in 550
points profit in one week! Re-entry is possible later if the stop
is taken out.
3/5/2009
- It
is Cowan's view that the recent plunge in stock market prices should not
be seen as a source of fear, rather a rare opportunity to buy quality
companies at panic low prices. Investors at these levels will thank
their lucky stars.
Many stock market cycle clusters arrive in March. One studied in the
course is the slow moving Saturn-Uranus, plotted below with
CycleTimer software, moving 180
degrees from the 1987 crash low.