|
|


Version 2.4.1 Released
7/3/2022
(The lifetime of any previous version has
expired and they are no longer supported)
Software Based on Bradley Cowan's
Award Winning Books
and
WD Gann
Techniques
(Windows XP thru 11 - No Mac Without Emulator)
Available as Download
Owners of Four-Dimensional Stock Market Structures and Cycles set of 2 books receive a $100 discount. Owners of Cowan's 4-book course receive a $200 discount. E-Books have the same discount. For discounts to apply the buyer's name must be on file with us as having purchased the course from Stock Market Geometry.
Purchase price includes 3 licenses. Licenses must be used within one year of purchase date. Three additional licenses are $300.
Just a few of the things added to Version 2
- Intraday Analysis With Midheaven, Ascendant, ARMC
- Topocentric and Barycentric
- WD Gann's Price by Degrees
- WD Gann's 'Mean of Five' and 'Cycle of Eight'
- North Node, South Node, Perihelion (Perigee), Aphelion (Apogee) of All Bodies
- Ephemeris
- Aspectarian
- Transits with Orb of Influence
- Convert CSI, Metastock, TC2000 files to ASCII
- Workspaces Saved as XML Files
- Asteroids: Chiron, Vesta, Pholus, Pallas, Juno
- Speed of Light Correction (Can be 4+ hours for outer planets)
- Multiple Date Formats Including Julian and Non-USA
- Overlay Speed and Price-Degree On Same ChartWD Gann Price by Degree
New additions to Version 2 include WD Gann's PricexDegree. This technique converts a planet's longitude to price and uses it as a support/resistance line. Gann explained this in his courses, which are reproduced on pages 84-86 of Rare Writings of WD Gann.
One of Gann's personal charts of May Soybeans is shown below as an example of how easy it is to plot Price by Degree using CycleTimer Intraday. Gann plotted Jupiter and Mars by hand on this chart. CycleTimer does it automatically.
High Resolution Ephemeris With Speed of Light Correction
Aspectarian
Intraday Analysis With Charts From 1 Minute to Monthly
Planetary Cycle Analysis Allows For Speed of Light Correction
.gif)
The below descriptions
are included from Version 1
because they are also found in Version 2.
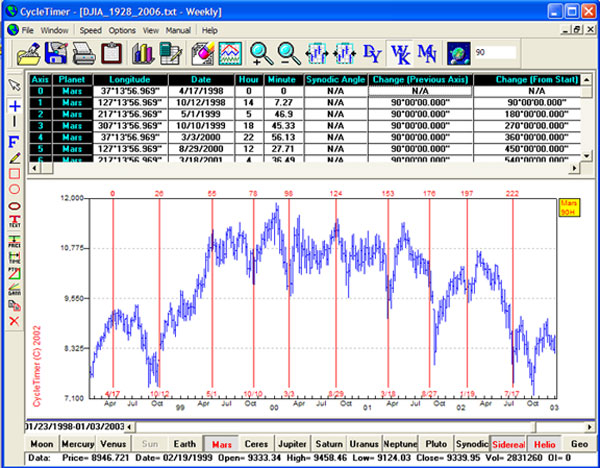
Identify and Project Your Cycles in Seconds
By simply dragging your cursor to a top or bottom on your chart you can identify and project any planetary combination on your chart. The chart below shows the Mars cycle as it moves 90 degrees in the weekly DJIA. The spreadsheet on the top prints out the details.
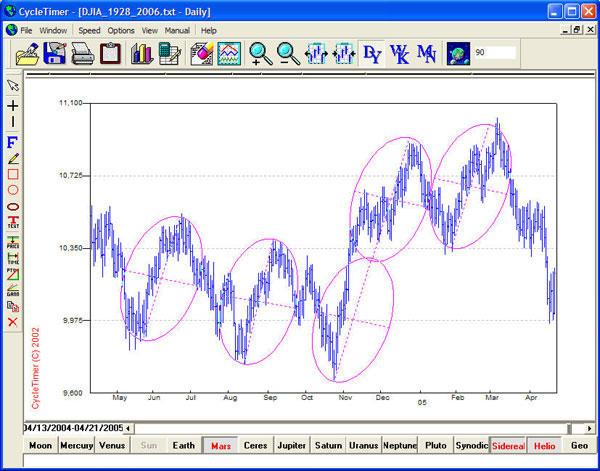
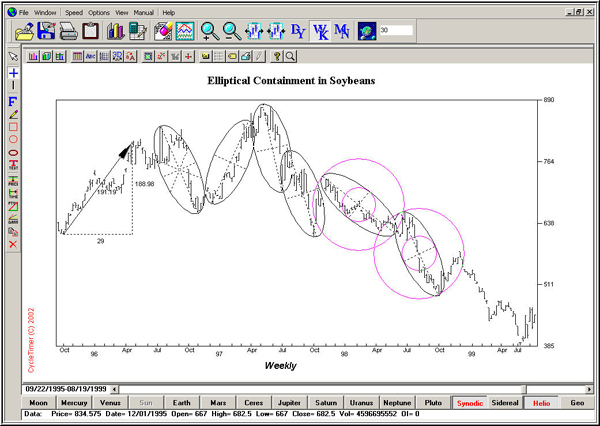
Ellipse Drawing Tool is the Easiest to Use and Most Versatile
Just click your mouse on a top or bottom and drag across your chart to easily draw an ellipse of any size and at any angle. When finished you can edit the location, size, angle, etc to fine tune it to your market data. Then clone that ellipse and drag it to other areas of your chart to identify the dominant price-time limits of your market data. Future movements are contained within the limits of the perimeter of these ellipses.
The chart below shows ellipses cloned in the daily DJIA. The first ellipse was drawn and all the others simply cloned and dragged to a top or bottom.
Multiple Charts Can Be Plotted in the Same Window
This allows you to plot many combinations of cycles. The chart below, on the left, shows two planetary cycles in soybeans that are described in Market Science. Plotted below these cycles is the speed of a third planet. A planet's speed reaches its extremes at perihelion and aphelion, the two points closest and furthest away from the sun. CycleTimer allows you to plot below your chart any combination of planets speeds added together or subtracted.
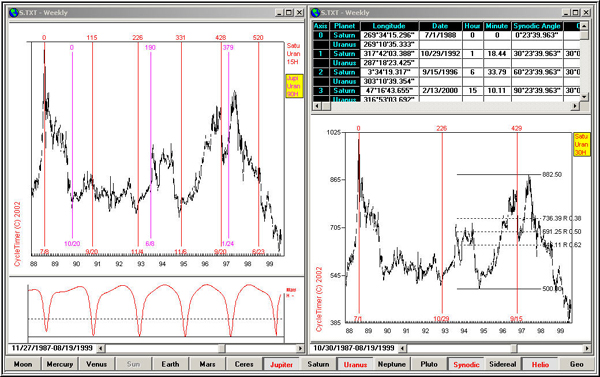
Shown in the Chart Below:
- Price-Time Vectors are quickly calculated by simply dragging your mouse.
- Ellipses can be drawn with any number of inner axes at equal angles.
- The inner and outer circles of ellipses can be included if desired.
|
Many more software features including:
DISCOUNTS:
|
|
|
|
|