|


|
Market Science - Volume II
Market Dynamics
Available as Full Color eBook (PDF)
 Soybeans - Stock Market - Live Cattle Soybeans - Stock Market - Live Cattle
This is the fourth book in this
unique series and is arguably one of the most valuable source of market information ever printed.
A statement like this is not made lightly because hard facts have to be provided to prove
it. Market Dynamics does what has never before been done by anyone, anywhere, at
any time. It provides a model, based on a simple number series, that defines every major
turning point in price-time. The resolution of this model is shown to be within two
cent-days over the entire historical record of soybeans, beginning in 1913.
THIS BOOK PROVES THAT MARKET MOVEMENTS ARE PERFECTLY ORDERED. Not only are
soybeans and live cattle studied, but a STOCK MARKET GROWTH SPIRAL AND CYCLE UPDATE
is also provided, showing the perfect order within the growth spiral of that market, after
the crash of 1987.
Lesson XIII - Non-Euclidean Price-Time
Geometry
Financial markets typically follow non-linear trends. This curvilinear nature of
price-time is caused by the curvature of the time element, a fact that has been proven by
the Theory Of Relativity.
|
 |
This lesson studies in detail the curvilinear geometric forms that evolve in financial
markets, demonstrating these constructs in SOYBEANS, LIVE CATTLE, AND THE STOCK MARKET.
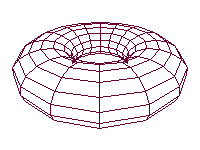
As Price-Time Vectors rotate around a point they create ellipses. As
these ellipses are revolved around an axis they sweep out the torus,
which defines the containment perimeter of price-time action.

Lesson XIV - Quantum Energy Levels of
Freely Traded Markets
This lesson isolates and identifies the dominant number series defining the progression
of growth spirals in the soybean market and shows that the natural law governing this
progression is the same used to model the basic element of matter, i.e., the structure of
the atom. Readers will recognize this from their high school chemistry as the s, p, d, f
energy levels. When market movements, in both price and time, can be accurately modeled by
a number series, projections of the future magnitudes of these movements become
mechanical.
Lesson XV - Soybean Cycles
 This
lesson identifies and proves the dominant cycles in soybeans,
using the most complete historical data available. The locations
of these cycles are provided showing projections of when to
expect future turning points. Anyone actively involved in this market, who does not know the locations of
these cycles, is setting himself up for financial disaster. This
lesson identifies and proves the dominant cycles in soybeans,
using the most complete historical data available. The locations
of these cycles are provided showing projections of when to
expect future turning points. Anyone actively involved in this market, who does not know the locations of
these cycles, is setting himself up for financial disaster.
|
Lesson XVI - Square of Fifty-Two
The square of fifty-two is one of the most important cycles in many markets, including
soybeans. One-fourth of this square is the 13-year cycle that defined such moves as the
1973 to 1986 bear market. The planetary correlation with this square is demonstrated.
Trade With Cycles... Know When to Sell
Cycles determine the trend and how long that trend will last before reversing
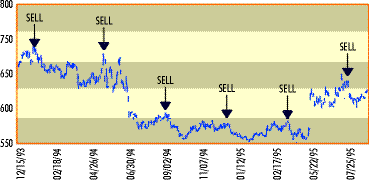
direction. If you consistently trade against the trend you will lose money. The chart
shown below is the daily May contract for soybeans, between the major top in January, 1994
and August, 1995. The cycle work gave six sell signals during this time. All SIX NAILED
THE TOP TO THE DAY! All of these tops were determined when the January, 1994 top
completed. Buy signals are generated by a different cycle that is equally accurate. If you
want to trade with a longer or shorter time period there are accurate cycles pinpointing
turns in those time frames.
Daily May Soybeans

Learn How to Predict Future Market Cycles
To determine in advance when the direction of the trend will change you must know the
locations of the cycles. Four-Dimensional Stock Market Structures And Cycles and Market
Science teaches the true construct of market cycles. Although most traders think that
cycles move in a straight line trending either up or down, this is not the case. Just like
everything else in nature that is set into revolving motion, MARKET CYCLES MOVE IN
ELLIPSES. Chart XII.D in Market Dynamics shows how the soybean market was
contained by a large elliptical cycle between 1978 and 1998. After that ellipse was
penetrated, prices quickly collapsed to 20 year lows.
Ellipses Define the Trend
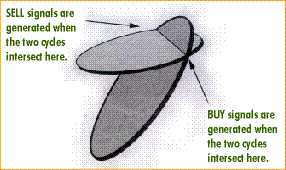
It is the interaction between two or more ellipses that causes the direction of the
trend to change. For example, the figure shown below is that of two ellipses intersecting.
The perimeters of these two ellipses come together at the two points identified by the
arrows. As the cycle moves around the perimeter of one ellipse, the market trends upward
until it reaches the point where the two ellipses come together, then the market makes a
top and reverses direction. The same happens at the other point defining the market
bottom. The larger ellipses define the long-term trend and the smaller ellipses define the
smaller moves.

Stock Market Cycle and Growth Spiral Update
This lesson provides an update of the locations of the stock market cycles identified
in Four-Dimensional Stock Market Structures And Cycles. These cycles have repeated
very reliably and defined THE TIMING AND MAGNITUDES of the drops into the 4/1994,
11/1994, 4/1997, 10/1997, 4/1998 and 10/1998 bottoms. Additonal stock market material
includes a breakdown of the sections of the growth spiral that unfolded between the crash
of 1987 and 1995. The points of force defining the limits of the movements since the 1987
crash have worked out perfectly.
Applications of the Musical Fifth to
Financial Market Timing
The Pythagorean musical scale is based on the musical fifth, or a
ratio of 3:2. This same ratio is found in the expansion and
decomposition of growth spirals in all markets. Market Dynamics
demonstrates the importance of the musical fifth in soybeans by showing
that the structure of growth spirals follows the same mathematical
principles used by Pythagoras when he created his musical scale. The
DJIA is used as the stock market example.
Dimensions of Ancient Temples and Soybean Growth
Spirals
Mr. Cowan has spent years traveling the world studying various
ancient temples. This work is intended as an introduction to this
subject and shows that the same dimensions chosen throughout the world
by the ancient architects of such temples as the Tower Of Babel, the
Ziggurat Of Ur, and the Tiahuanaco Ruins in Bolivia are found in the
expansion of financial market growth spirals. These numbers are
IDENTICAL to those defining the growth spiral expansion and
contraction of the soybean market. Considered sacred by the ancient
masters, these numbers defined the dimensions of their holy temples and
monuments. These structures were felt to be the greatest tributes they
could make to their god.
|
[
Volume I - Square of Twelve |
Place Order ]
Course-Part I |
Course-Part II |
Gann Courses |
Long-Term Data | Catalog
Place Order |
About the Author |
Market Calls |
Testimonials
|
Home


Copyrightę 2015 Stock Market Geometry. All Rights Reserved
|
Soybeans - Stock Market - Live Cattle


 This
lesson identifies and proves the dominant cycles in soybeans,
using the most complete historical data available. The locations
of these cycles are provided showing projections of when to
expect future turning points. Anyone actively involved in this market, who does not know the locations of
these cycles, is setting himself up for financial disaster.


